


Salesforce-Tableau-Consultant Exam Questions With Explanations
The best Salesforce-Tableau-Consultant practice exam questions with research based explanations of each question will help you Prepare & Pass the exam!


Over 15K Students have given a five star review to SalesforceKing


Why choose our Practice Test
By familiarizing yourself with the Salesforce-Tableau-Consultant exam format and question types, you can reduce test-day anxiety and improve your overall performance.
Up-to-date Content
Ensure you're studying with the latest exam objectives and content.
Unlimited Retakes
We offer unlimited retakes, ensuring you'll prepare each questions properly.
Realistic Exam Questions
Experience exam-like questions designed to mirror the actual Salesforce-Tableau-Consultant test.
Targeted Learning
Detailed explanations help you understand the reasoning behind correct and incorrect answers.
Increased Confidence
The more you practice, the more confident you will become in your knowledge to pass the exam.
Study whenever you want, from any place in the world.

Salesforce Salesforce-Tableau-Consultant Exam Sample Questions 2026
Start practicing today and take the fast track to becoming Salesforce Salesforce-Tableau-Consultant certified.
21004 already prepared
Salesforce 2026 Release100 Questions
4.9/5.0
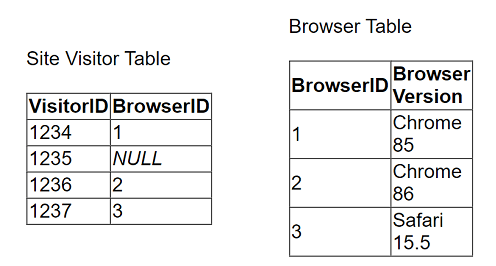
A client collects information about a web browser customers use to access their website.
They then visualize the breakdown of web traffic by browser version.
The data is stored in the format shown below in the related table, with a NULL BrowserID
stored in the Site Visitor Table if an unknown browser version
accesses their website.
The client uses "Some Records Match" for the Referential Integrity setting because a
match is not guaranteed. The client wants to improve the performance of
the dashboard while also getting an accurate count of site visitors.
Which modifications to the data tables and join should the consultant recommend?
A. Continue to use NULL as the BrowserID in the Site Visitor Table and leave the Referential Integrity set to "Some Records Match."
B. Add an "Unknown" option to the Browser Table, reference its BrowserID in the Site Visitor Table, and change the Referential Integrity to "All Records Match."
C. Add an "Unknown" option to the Browser Table, reference its BrowserID in the Site Visitor Table, and leave the Referential Integrity set to "Some Records Match."
D. Continue to use NULL as the BrowserID in the Site Visitor Table and change the Referential Integrity to "All Records Match."
Explanation:
The goal is twofold: improve performance and get an accurate count of site visitors. Let's analyze how this solution achieves both.
Accurate Count of Site Visitors:
In the current setup, the visitor with VisitorID 1235 has a NULL BrowserID. In a standard left outer join from Site Visitor to Browser, this record would be lost because there is no matching BrowserID in the lookup table.
By adding an "Unknown" record to the Browser table (e.g., BrowserID 4, Browser Version "Unknown") and replacing the NULL values in the Site Visitor table with this new ID (4), every single site visitor now has a valid, matching BrowserID.
This ensures that when the tables are joined, no visitor records are dropped, guaranteeing an accurate count.
Improve Performance:
The Referential Integrity setting tells the analytics engine about the relationship between the two datasets.
"Some Records Match" is a safe but performance-intensive setting. The engine must assume that records on both sides might not have a match, so it performs a full outer join logic to ensure no data is lost. This is computationally expensive.
"All Records Match" is a performance-optimized setting. The engine can assume that for every record in the primary table (Site Visitor), there is a corresponding record in the lookup table (Browser). This allows the engine to use a more efficient inner join or optimized left join.
By eliminating NULLs and ensuring every Site Visitor record has a match, we can confidently set the Referential Integrity to "All Records Match," unlocking this performance optimization.
Why the other options are incorrect:
A. Continue to use NULL... leave... "Some Records Match.": This maintains the current state. The count will be inaccurate (Visitor 1235 is lost), and performance is not improved because the engine still has to use the slower "Some Records Match" logic.
C. Add an "Unknown" option... leave... "Some Records Match.": This fixes the data accuracy problem (Visitor 1235 is now counted as "Unknown"), but it fails to improve performance. The Referential Integrity is still set to the slower "Some Records Match" even though a match is now guaranteed.
D. Continue to use NULL... change to "All Records Match.": This is the worst option. It will break the dashboard. Changing to "All Records Match" when there are NULL values (which guarantee no match) in the Site Visitor table will cause the engine to drop the record for Visitor 1235 during processing, leading to an inaccurate count and potentially confusing results.
Reference & Key Concepts:
Referential Integrity in CRM Analytics: This is a crucial setting when configuring relationships in a data recipe or a lens. It's not a data validation rule but a hint to the query engine about the nature of the data to optimize query performance.
All Records Match: Use for performance when you are sure every record in the primary table has a match in the lookup table.
Some Records Match: Use as a default when you are unsure, or when there are known non-matching records (like the NULL values in the original problem).
Data Modeling for Analytics: A best practice is to eliminate NULL foreign keys by creating "Unknown" or "Not Provided" records in your dimension tables. This ensures referential integrity is maintained for both accurate reporting and performance.

Prep Smart, Pass Easy Your Success Starts Here!
Transform Your Test Prep with Realistic Salesforce-Tableau-Consultant Exam Questions That Build Confidence and Drive Success!

Frequently Asked Questions