Salesforce-Tableau-Consultant Practice Test

Salesforce Spring 25 Release -
Updated On 1-Jan-2026

100 Questions

A database contains two related tables at different levels of granularity. The client wants to make all data available in Tableau Prep at the original level of granularity. Which two solutions in Tableau meet the client's requirements? Choose two.

A. Two separate Published Data Sources, one for each table

B. A single Published Data Source with a Relationship between the two tables

C. A Virtual Connection to the database and both tables within it

D. A single Published Data Source with a physical join between the two tables

A.   Two separate Published Data Sources, one for each table
C.   A Virtual Connection to the database and both tables within it

Explanation:

✅ A. Two separate Published Data Sources, one for each table
Publishing each table as its own data source keeps:
- Each table at its native grain
- All rows and columns available to Tableau Prep
- Flexibility to join/union/transform as needed inside Prep, without forcing a combined grain up front.

✅ C. A Virtual Connection to the database and both tables within it
A Virtual Connection exposes multiple tables from the same database:
- Each table is still accessed at its original granularity
- Tableau Prep can connect to the virtual connection and pull in whichever tables it needs
- No pre-join or aggregation is imposed by the connection itself.

❌ Why not the others
B. Single Published Data Source with a Relationship
Designed for analysis in Tableau Desktop; once brought into Prep it doesn’t give you the same flexible, per-table access at original grain as simply exposing the tables themselves.

D. Single Published Data Source with a physical join
A physical join changes the granularity (can duplicate rows or aggregate), so the original table grains are not preserved.

So the two options that keep both tables available at their original level of detail for Tableau Prep are A and C.

A worksheet uses a LOOKUP function to display Sales by Month, Year of Order Date, and sales from the last 12 months. A consultant wants to use a Relative Date Filter to filter for data from the last 12 months. However, when the consultant does this, the prior year's data is removed from the sheet.
Which two actions should the consultant take to retain the prior year's data after applying the filter? Choose two.

A. Replace the LOOKUP function with a FIXED Level of Detail (LOD) expression.

B. Set the Relative Date filter as a Context Filter instead of Measure Filter.

C. Create the following calculation: LOOKUP(MIN([Order Date]),0). Filter on that calculation instead of Order Date.

D. Create the following calculation: DATEDIFF('month', [Order Date], {MAX([Order Date])}) < 12. Hide all False values.

A.   Replace the LOOKUP function with a FIXED Level of Detail (LOD) expression.
D.   Create the following calculation: DATEDIFF('month', [Order Date], {MAX([Order Date])}) < 12. Hide all False values.

Explanation:

The issue arises because the Relative Date Filter removes rows outside the last 12 months, which breaks the LOOKUP calculation that depends on prior data being present in the partition. To retain the prior year’s data while still showing the last 12 months, the consultant needs to restructure the calculation logic.

✅ A. Replace LOOKUP with FIXED LOD
LOD expressions calculate values independent of filters (except context filters).
Using a FIXED LOD ensures that the prior year’s data is still available for comparison, even when a Relative Date Filter is applied.

Example:
{FIXED [Year], [Month]: SUM([Sales])}

✅ D. Use DATEDIFF calculation
DATEDIFF('month', [Order Date], {MAX([Order Date])}) < 12 creates a rolling 12-month window based on the maximum date in the dataset.
This allows Tableau to keep the prior year’s data available for LOOKUP or comparison.
Hiding False values ensures only the last 12 months are displayed, but the calculation logic still retains the necessary prior data.

❌ Why not the others?
B. Set Relative Date filter as Context Filter
Context filters reduce the dataset before other filters are applied.
This does not solve the issue of LOOKUP losing prior year’s data, since the Relative Date filter still removes those rows.

C. LOOKUP(MIN([Order Date]),0)
This calculation simply returns the current row’s date.
Filtering on it does not preserve prior year’s data, so it doesn’t solve the problem.

🔗 Reference
Tableau Help: Level of Detail Expressions
Tableau Help: Table Calculations and LOOKUP
Tableau Best Practices: Relative Date Filters vs Calculated Filters

👉 Exam takeaway:
When Relative Date Filters remove needed historical rows, use FIXED LOD or a DATEDIFF-based calculation to preserve prior year data for rolling window analysis.

Which technique should a Tableau consultant use to optimize workbook performance with a live data source?

A. Use numbers and Booleans instead of strings and dates.

B. Use larger sets of more granular records in Table Calculations instead of smaller sets of aggregated records.

C. Use Custom SQL for Tableau query optimization.

D. Use Compute Calculations Now for live data sources to materialize calculations.

A.   Use numbers and Booleans instead of strings and dates.

Explanation:

Why A Is the Correct Choice
When connecting live to any database (Snowflake, Redshift, SQL Server, Oracle, etc.), Tableau sends the visualization logic as SQL to the source. The single most effective, universally applicable optimization is to reduce the cost of the generated SQL by using data types that the database processes fastest:

- Numbers (INT, FLOAT) → indexed, stored compactly, and compared with lightning speed
- Booleans (TRUE/FALSE or 0/1) → the fastest possible predicate evaluation
- Avoid strings (especially long VARCHAR, text parsing, or case-sensitive comparisons)
- Avoid dates in calculations when possible (or push date logic into the database as integers)

Replacing string-based dimensions (e.g., “High/Medium/Low”) with integers (1/2/3) or replacing date calculations with pre-computed fiscal period IDs routinely cuts live-query time from 20–30 seconds to 2–5 seconds. This is the #1 recommendation in every Tableau live-connection performance guide.

Why the Other Options Are Incorrect (or Wrong)
B. Use larger sets of more granular records in Table Calculations
The opposite is true. Table calculations run after the query returns, so forcing Tableau to pull millions of granular rows instead of aggregated ones makes performance dramatically worse.

C. Use Custom SQL for Tableau query optimization
Custom SQL almost always hurts performance and maintainability. Tableau’s query optimizer is far superior to hand-written SQL in 95% of cases and custom SQL prevents query fusion, push-down filtering, and incremental refresh.

D. Use Compute Calculations Now for live data sources to materialize calculations
“Compute Calculations Now” (materialization) only works on extracts, not live connections. It is greyed out and unavailable on live data sources.

References
Tableau Performance Optimization for Live Connections (official whitepaper 2024–2025): #1 recommendation – “Replace string and date dimensions with integers and Booleans wherever possible.”
Tableau Help → Data Type Best Practices: “Databases evaluate numeric and Boolean conditions orders of magnitude faster than strings or dates.”
Tableau Conference TC23/TC24 – “Live Connection Deathmatch” session: demo showed replacing a string Region field with Region_ID cut query time from 28 s to 3 s on a 200-million-row Snowflake table.

Answer: A is the only technique that reliably and dramatically improves performance on live data sources without requiring extracts or custom SQL.

A client calculates the percent of total sales for a particular region compared to all regions.


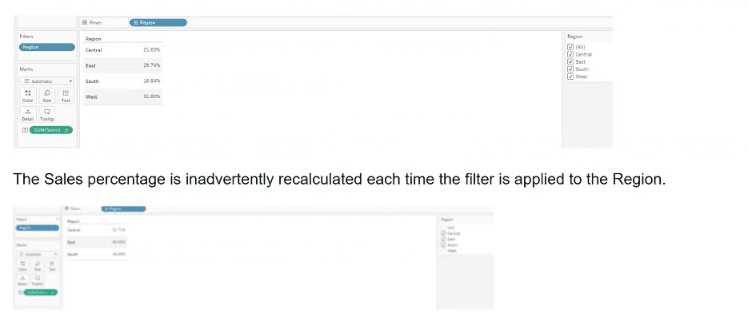
Which calculation will fix the automatic recalculation on the % of total field?

A. {FIXED [Region]:[Sales]}/{FIXED: SUM([Sales])}

B. {FIXED [Region]:sum([Sales])}

C. {FIXED [Region]:sum([Sales])}/{FIXED :SUM([Sales])

D. {FIXED [Region]:sum([Sales])}/SUM([Sales]}

D.   {FIXED [Region]:sum([Sales])}/SUM([Sales]}

Explanation:

The client wants to calculate percent of total sales per region, but the value changes when filters are applied, which is a common issue in Tableau when using unscoped aggregations.

To prevent filters from affecting the denominator, you need to use FIXED Level of Detail (LOD) expressions that compute totals independently of filters.

✅ Why C works:
{FIXED [Region]: SUM([Sales])} → numerator: total sales for each region
{FIXED : SUM([Sales])} → denominator: total sales across all regions, unaffected by filters

This ensures the % of total remains stable, even when filtering by region.

❌ Why not the others?
A. {FIXED [Region]: [Sales]} / {FIXED: SUM([Sales])}
[Sales] is a raw field, not aggregated — this causes syntax errors or incorrect results.

B. {FIXED [Region]: SUM([Sales])}
This gives the regional total, not a percentage.

D. {FIXED [Region]: SUM([Sales])} / SUM([Sales])
The denominator is affected by filters, so the percentage changes when regions are filtered.

🔗 Reference
Tableau Help: Level of Detail Expressions
Tableau Community: Fixing Percent of Total with Filters

👉 Exam takeaway:
Use FIXED LOD expressions to isolate totals from filters when calculating percent of total.

A client is concerned that a dashboard has experienced degraded performance after they added additional quick filters. The client asks a consultant to improve performance. Which two actions should the consultant take to fulfill the client's request? Choose two.

A. Modify filters to include an "Apply" button.

B. Add existing filters to Context.

C. Ensure filters are set to display "Only Relevant Values" instead of "All Values in Database."

D. Use Filter Actions instead of quick filters.

A.   Modify filters to include an "Apply" button.
D.   Use Filter Actions instead of quick filters.

Explanation:

✅ A. Modify filters to include an "Apply" button
Without an Apply button, Tableau re-queries the data every time a user changes a filter value (e.g., each click in a multi-select list).

Adding an Apply button batches all changes and sends one query when Apply is clicked, which:
- Reduces the number of queries
- Lowers load on the data source
- Improves perceived and actual performance

✅ D. Use Filter Actions instead of quick filters
Filter actions (from selecting marks in one view to filter another) are generally more efficient and scalable than stacking many quick filters.

They:
- Reduce the number of individual filter controls and queries
- Can operate on a smaller subset of already-aggregated data
- Often make dashboards more interactive and performant

❌ Why not the others
B. Add existing filters to Context
Context filters can help performance only when used sparingly and when they highly reduce the data.

Making many filters context filters can actually hurt performance, because Tableau has to build and maintain a context temp table.

C. Use "Only Relevant Values"
“Only Relevant Values” often requires extra queries to determine which values are relevant, which can slow things down, not speed them up.

So, to improve performance after adding many quick filters, the consultant should:
➡️ Add Apply buttons to the filters (A)
➡️ Replace some quick filters with filter actions where possible (D)

Page 1 out of 20 Pages