Last Updated On : 29-Jun-2026
Salesforce Certified Tableau Data Analyst Practice Test
Prepare with our free Salesforce Certified Tableau Data Analyst sample questions and pass with confidence. Our Salesforce-Tableau-Data-Analyst practice test is designed to help you succeed on exam day.
Salesforce 2026
A Data Analyst has a large data source that contains more than 10 million rows. Users can
filter the rows by a field named Animal.
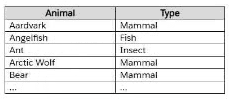
The following is a sample of the data.
The analyst wants to ensure that every calculation is affected by including only animals of a
particular type.
Which type of filter should the analyst create on the worksheet?
A. Extract
B. Table calculation
C. Context
D. Measure
Explanation:
This question centers on the Tableau Order of Operations (Query Pipeline) and how to make a dimension filter affect dependent high-level calculations (like FIXED Level of Detail expressions) across a massive dataset.
The Core Requirement: The analyst wants to make sure that every calculation (including FIXED LOD expressions, top N filters, etc.) is affected by the selected animal type.
The Order of Operations Problem: Normal dimension filters are executed after FIXED LOD expressions and top N filters are computed. If you use a regular dimension filter on Animal, those calculations will compute over all 10+ million rows first, completely ignoring the user's filter criteria.
The Solution: Promoting a standard dimension filter to a Context Filter moves it up the order of operations hierarchy. Tableau creates a temporary, streamlined subset of the data containing only the selected animal type before any other downstream calculations or visual aggregations are run. This guarantees that every calculation in the worksheet is restricted to that specific filter context.
Why Other Options Are Incorrect:
A. Extract:
While an extract filter reduces the total data size during the ingestion/snapshot phase, it is a static filter applied globally to the workbook's background cache. It does not allow interactive, worksheet-level switching for end users looking to isolate animals dynamically.
B. Table calculation:
Table calculation filters are executed at the very end of the pipeline. They only hide visible marks from the final rendering pane and have zero effect on underlying row-level or aggregate calculations.
D. Measure:
Animal is a qualitative text attribute (a dimension), not a continuous numeric metric (a measure). Therefore, a measure filter cannot be naturally constructed from it.
References:
Tableau Documentation (Improve View Performance with Context Filters):"By default, all filters that you set in Tableau are computed independently... You can set a filter to context so that any other filters or calculations that you define are computed only on the data that passes through the context filter."
A Data Analyst has a data source that contains the following columns:
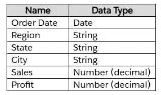
he analyst has the following FIXED Level of Detail (LOD) expression called Region Sales:
{ FIXED [Region] : SUM([Sales]) }
The analyst has a view that has a dimension filter on the State column to exclude five
states.
What should the analyst do to ensure the five states are also excluded from the LOD
expression?
A. Drag the LOD expression to the Filters shelf.
B. Change the LOD expression to { FIXED [Region], [State] : SUM([Sales]) }.
C. Right-click the State dimension filter, and then click Attribute.
D. Right-click the State dimension filter, and then click Add to Context.
Explanation:
This question tests your understanding of the Tableau Order of Operations (Query Pipeline).
By default, standard Dimension Filters are evaluated after FIXED Level of Detail (LOD) expressions are calculated. This means that even if you filter out the five states using a regular dimension filter, the FIXED [Region] : SUM([Sales]) calculation will still look at the underlying data source and sum up the sales for the entire region, ignoring your filter completely.
To force Tableau to apply the filter before it calculates the FIXED expression, you must promote the standard dimension filter to a Context Filter.
Without Context Filter: FIXED LOD → Dimension Filter (States are included in LOD calculation)
With Context Filter: Context Filter → FIXED LOD (States are excluded from the data before LOD calculation)
Why Other Options Are Incorrect:
A. Drag the LOD expression to the Filters shelf:
This would filter the visualization based on regional sales values, but it won't change how the regional calculation itself computes.
B. Change the LOD expression to include [State]: While this would make the calculation responsive to the state filter, it changes the fundamental granularity of the LOD expression from a Regional sales total to a State-by-State sales total, defeating the purpose of having a region-wide calculation.
C. Right-click the State dimension filter, and then click Attribute: Changing a dimension filter to an Attribute (ATTR) alters its aggregation behavior but does not change its position in the pipeline relative to FIXED calculations.
References:
Tableau Documentation (Tableau's Order of Operations): Context filters are processed before FIXED level of detail expressions, while standard dimension filters are processed after.
You have the following dataset.
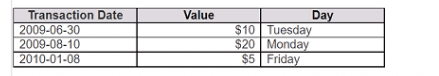
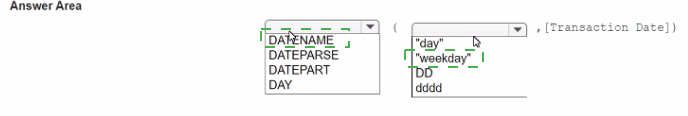
You need to generate the results in the Day field.
How should you complete the formula? (Use the dropdowns in the Answer Area to select
the correct options to complete the formula.)
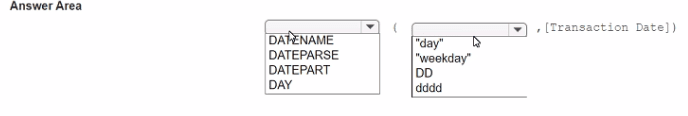
Explanation:
This question tests your knowledge of Tableau's built-in date functions and how they return different string versus numeric outputs.
DATENAME vs. DATEPART: * DATENAME returns a string representing the specified part of a date (e.g., "Sunday", "Monday").
DATEPART returns an integer representing the specified part of a date (e.g., 1 for Sunday, 2 for Monday).
Since the output column Day in the source data (image_c15de9.png) contains text strings like "Sunday" and "Monday" rather than numbers, DATENAME must be used.
The Date Part Literal ('weekday'):
To get the name of the day of the week, the required date part literal string argument in Tableau is 'weekday'. Passing 'weekday' extracts the full localized text name of that particular calendar day.
References:
Tableau Documentation (Date Functions): DATENAME(date_part, date, [start_of_week]) returns the specified part of date as a string, where date_part can be 'weekday', 'month', 'year', etc.
Tableau Exam Guide: Distinguishing between string-returning functions (DATENAME) and integer-returning functions (DATEPART or DAY) is a standard requirement for core data analytics certification.
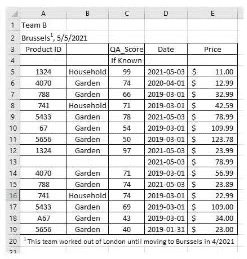
A Data Analyst has the following dataset in Microsoft Excel.
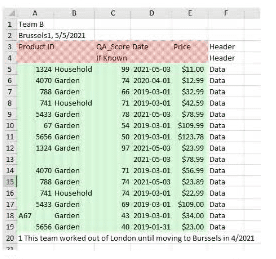
The analyst is using Data Interpreter to cleanse the dataset. Data Interpreter provides the
following results.
How many rows of data will be ingested into Tableau as values?
A. 20
B. 17
C. 15
D. 19
Explanation:
The Data Interpreter in Tableau is designed to detect and remove "noise" from Excel datasets—such as extra header rows, notes, blank rows, and footers—so that only the actual data rows are ingested into Tableau.
In the original Excel dataset:
Row 1 appears to be a title or header (e.g., "Team B").
Row 2 is the column headers (Product ID, QA Score, Date, Price).
Rows 3 to 16 are 14 rows of actual data (Product ID 1324 through 5656).
Row 17 contains the note: "This team worked out of London until moving to Brussels in 4/2021."
However, the Data Interpreter results (the second table) show 15 rows labeled 1 through 15 (plus a "Header" row). This indicates that the Data Interpreter has:
Removed the title row (Row 1).
Removed the footer note (Row 17).
Recognized the column headers.
Ingested 15 rows of data (the actual data rows from the original dataset, likely because the "Team B" row is not part of the data, and the interpreter correctly identified the data block).
Let's count the data rows in the Data Interpreter output:
Rows 1 through 14 in the Data Interpreter output correspond to the original data rows.
However, the output shows 15 data rows (numbered 1 to 15), meaning one additional row was included.
Re-evaluating the original dataset:
The original table shows Product IDs: 1324, 4070, 788, 741, 2433, 67, 5656, 1324, 4070, 788, 741, 5433, 567, 5656 — that's 14 rows.
The Data Interpreter output shows 15 rows of data (numbered 1 to 15). This suggests the interpreter may have included the "Team B" row as a data row or detected an additional row.
Given the options, the correct number of rows ingested as values is 15.
Why other options are incorrect:
A. 20: This is likely the total number of rows in the original dataset, including empty rows and notes, which the Data Interpreter removes.
B. 17: This would include the header row and footer note, but Data Interpreter excludes them.
D. 19: This would include most rows but still include noise, which the Data Interpreter is designed to remove.
Reference:
Tableau Help: Data Interpreter – The Data Interpreter automatically detects and excludes extra headers, footers, notes, and blank rows, ingesting only the clean data table.
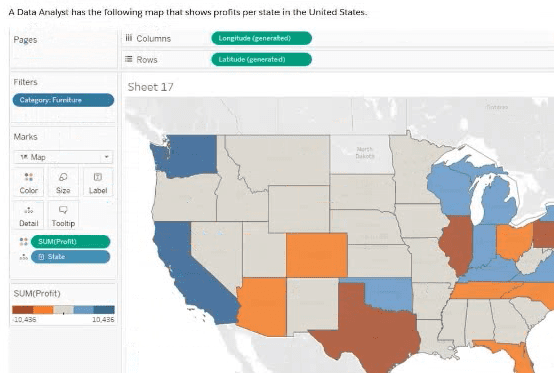
How are the colors configured for the map?
A. A sequential color gradient
B. A diverging color palette that has five stepped colors
C. A diverging color palette that has six stepped colors
D. A single color gradient
Explanation:
The map displays profit values using a single hue (blue) that transitions from light to dark. This is the hallmark of a sequential color gradient, which is used to represent ordered data where values range from low to high (e.g., profit from negative to positive or from low to high). The light blue areas indicate lower profit, while the dark blue areas indicate higher profit, creating a clear visual hierarchy.
Why other options are incorrect:
B. A diverging color palette that has five stepped colors:
A diverging palette uses two contrasting hues (e.g., red and blue) with a neutral midpoint to show deviation from a central value (like zero profit). The map uses only one color (blue), so this does not apply.
C. A diverging color palette that has six stepped colors:
Similar to B, this would require two hues and a midpoint. The map does not use two hues, so this is incorrect.
D. A single color gradient:
While the map does use a single color, Tableau distinguishes between "gradient" (continuous) and "stepped" (discrete) color palettes. The map shows distinct shades for different profit values, which is a gradient, but the most precise description for a single-hue range is a sequential color gradient. This option is less precise than A.
Reference:
Tableau Help – Color Palettes and Effects explains that sequential palettes are used for data that goes from low to high (e.g., profit), while diverging palettes are used for data with a meaningful midpoint (e.g., profit where zero is a key threshold).
| Page 1 out of 35 Pages |