Last Updated On : 18-Oct-2026
Salesforce Certified Tableau Data Analyst Practice Test
Prepare with our free Salesforce Certified Tableau Data Analyst sample questions and pass with confidence. Our Salesforce-Tableau-Data-Analyst practice test is designed to help you succeed on exam day.
Salesforce 2026
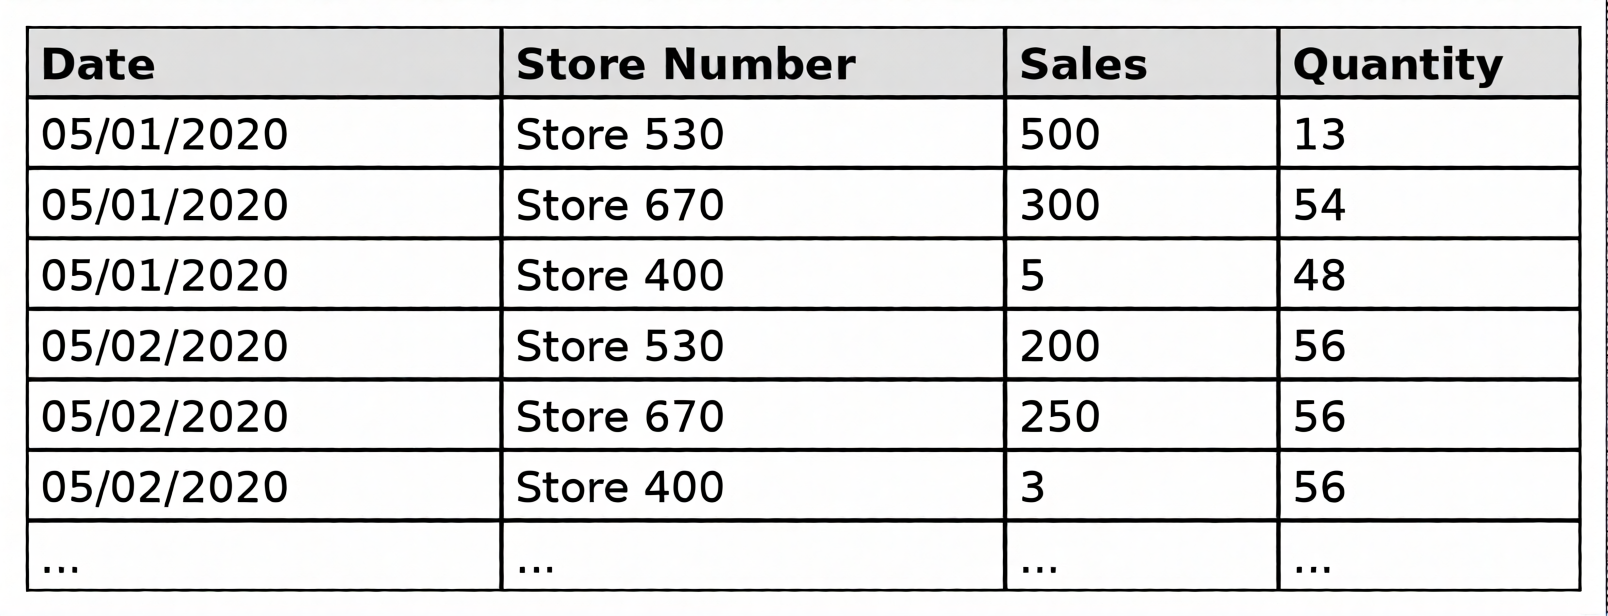
A Data Analyst has the following dataset that contains sales for the month of May.
The analyst plans to create a data extract from the dataset. The analyst wants to extract data only from stores
that have $500 or more in total sales.
What should the analyst do?
A. Create an extract filter on Sales and set the At least value.
B. Create an extract filter on Store Number and select Condition by field Sales.
C. Create an extract filter on Store Number and select Top by field Sales.
D. Create an extract filter on Store Number and select Top by field Store Number.
Explanation:
The correct answer is B. Create an extract filter on Store Number and select Condition by field Sales. The requirement is to extract only the data for stores whose total sales are $500 or more. Since a store may have multiple rows of sales transactions in the dataset, the filter must first aggregate sales by store and then apply the threshold. In Tableau, this is achieved by creating an extract filter on the Store Number dimension and selecting the Condition option, then choosing By field and setting the aggregation to SUM(Sales) with the condition "At least 500". This ensures that the extract includes all rows for stores that meet the total sales threshold, while excluding rows for stores that fall below it. This makes option B the correct answer.
Why the other options are incorrect:
A. Create an extract filter on Sales and set the At least value
– Filtering directly on the Sales measure applies the $500 threshold to individual sales transactions, not to the total sales per store. This would exclude individual rows with sales under $500 even if the store's total exceeds $500, which does not meet the requirement.
C. Create an extract filter on Store Number and select Top by field Sales
– The "Top" filter returns a specified number of top-ranked stores (e.g., Top 10 by Sales), not stores meeting a minimum sales threshold. It cannot express the condition "at least $500 in total sales."
D. Create an extract filter on Store Number and select Top by field Store Number
– This filters by the highest Store Numbers rather than by sales values, which is entirely unrelated to the requirement of extracting stores with $500 or more in total sales.
Reference:
Tableau Desktop Specialist and Tableau Data Analyst content areas on Extracts and Data Filtering — specifically creating extract filters, using the Condition filter option on a dimension, applying "By field" aggregation (SUM), and filtering based on aggregated measure thresholds.
A Data Analyst has the following table.
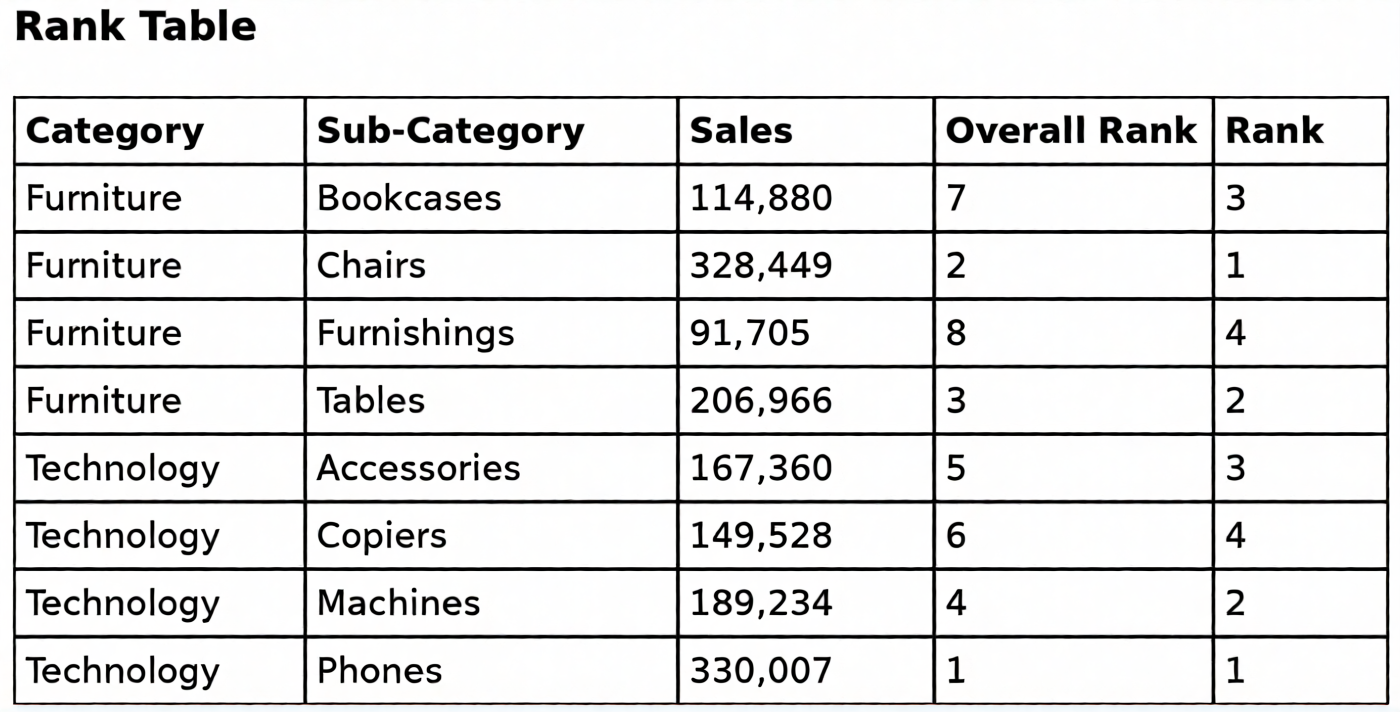
Overall Rank and Rank are calculated fields that use the RANK function.
The analyst filters out the Phones sub-category.
For which three sub-categories will the value of Rank change? Choose three
A. Chairs
B. Machines
C. Furnishings
D. Bookcases
E. Copiers
F. Tables
G. Phones
H. Accessories
E. Copiers
H. Accessories
Explanation
The correct answers are B. Machines, E. Copiers, and H. Accessories. The "Rank" column is a table calculation using the RANK function, which is partitioned by Category (as evidenced by the rankings restarting at 1 for each Category). When the "Phones" sub-category is filtered out, it is removed from the Technology partition. Phones currently holds Rank 1 in Technology with sales of 330,007. Removing it causes the remaining Technology sub-categories to shift up by one position: Machines moves from Rank 2 to Rank 1, Accessories moves from Rank 3 to Rank 2, and Copiers moves from Rank 4 to Rank 3. These three sub-categories will have changed Rank values. This makes options B, E, and H the correct answers.
Why the other options are incorrect:
A. Chairs
– Chairs belongs to the Furniture category and holds Rank 1 within that partition. Filtering out Phones, which is in the Technology partition, does not affect the Furniture partition, so Chairs retains its Rank of 1.
C. Furnishings
– Furnishings belongs to the Furniture category and holds Rank 4. Its rank is determined solely within the Furniture partition and is unaffected by the removal of Phones from the Technology partition.
D. Bookcases
– Bookcases belongs to the Furniture category and holds Rank 3. Since the Furniture partition is untouched by the filter on Phones, Bookcases retains its Rank of 3.
F. Tables
– Tables belongs to the Furniture category and holds Rank 2. Its rank remains unchanged because the filter only impacts the Technology partition.
G. Phones
– Phones is the sub-category being filtered out, so it will no longer appear in the view and will not have a Rank value at all. It cannot be one of the sub-categories whose Rank changes, since it is removed entirely.
Reference:
Tableau Desktop Specialist and Tableau Data Analyst content areas on Table Calculations — specifically the RANK function, partitioning and addressing dimensions, and how filtering out a dimension member affects rank values within a partition.
You have the following dataset. You want to create a new calculated dimension field named Category that meets the following conditions:
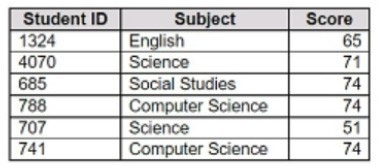
➡️ When Subject is Computer Science or Science, Category must be Sciences.
➡️ When Subject is English or Social Studies, Category must be Humanities.
Which two logical functions achieve the goal? Choose two.
A. IF [Subject]- 'Science' THEN 'Sciences'
ELSEIF [Subject]='English' THEN 'Humanities'
ELSEIF [Subject]-'Social Studies' THEN 'Humanities'
ELSEIF [Subject]= 'Computer Science' THEN 'Sciences'
END
B. IIF(( CONTAINS ([Subject], 'Science') = TRUE) , 'Humanities', 'Sciences')
C. IF ENDSWITH ( [Subject], 'Computer Science') THEN 'Sciences' ELSE 'Humanities' END
D. CASE [Subject]
WHEN 'Computer Science' THEN 'Sciences'
WHEN 'Science' THEN 'Sciences'
WHEN 'English' THEN 'Humanities'
WHEN 'Social Studies' THEN 'Humanities'
End
ELSEIF [Subject]='English' THEN 'Humanities'
ELSEIF [Subject]-'Social Studies' THEN 'Humanities'
ELSEIF [Subject]= 'Computer Science' THEN 'Sciences'
END
D. CASE [Subject]
WHEN 'Computer Science' THEN 'Sciences'
WHEN 'Science' THEN 'Sciences'
WHEN 'English' THEN 'Humanities'
WHEN 'Social Studies' THEN 'Humanities'
End
Explanation
To create a calculated dimension that classifies subjects into Sciences or Humanities, Tableau provides logical functions like IF/ELSEIF and CASE. These allow testing multiple conditions and assigning values accordingly. Using functions that rely solely on string matching (like CONTAINS or ENDSWITH) may not cover all required cases accurately. The goal is to map exact subject names to their corresponding category consistently.
✔️ Correct Options
A. IF / ELSEIF
This function checks each condition in order. It explicitly assigns:
'Science' → Sciences
'Computer Science' → Sciences
'English' or 'Social Studies' → Humanities
This ensures all subjects are mapped correctly. The order of ELSEIF statements allows multiple conditions to be checked sequentially.
D. CASE
The CASE function directly maps exact values of [Subject] to categories:
'Computer Science' & 'Science' → Sciences
'English' & 'Social Studies' → Humanities
It is concise, readable, and avoids errors that can occur with complex nested IF statements.
❌ Incorrect Options
B. IIF with CONTAINS
This checks if the string contains “Science” and then assigns values. However, it incorrectly maps “Science” subjects to Humanities instead of Sciences and cannot handle multiple subjects like Social Studies or English. It is not suitable for exact matching of multiple conditions.
C. IF ENDSWITH
Using ENDSWITH only evaluates whether the subject ends with a specific string. “Science” and “Computer Science” would be handled differently, and English or Social Studies would be incorrectly classified. This method does not fully satisfy the mapping rules.
📎 Reference
Tableau Help – Logical Functions (IF, ELSEIF, CASE)
https://help.tableau.com/current/pro/desktop/en-us/functions_functions.htm
| Salesforce-Tableau-Data-Analyst Exam Questions - Home |
| Page 2 out of 43 Pages |