Last Updated On : 29-Jun-2026
Salesforce Certified Tableau Consultant Practice Test
Prepare with our free Salesforce Certified Tableau Consultant sample questions and pass with confidence. Our Salesforce-Tableau-Consultant practice test is designed to help you succeed on exam day.
Salesforce 2026
A client calculates the percent of total sales for a particular region compared to all regions.
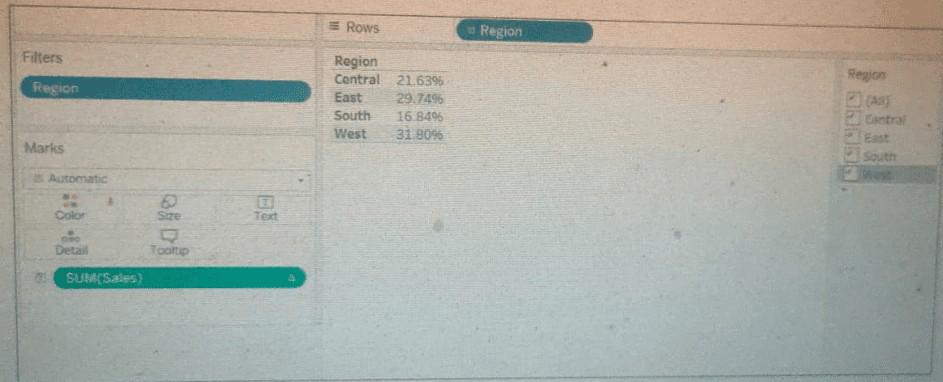 The Sales percentage is inadvertently recalculated each time the filter is applied to the
Region.
The Sales percentage is inadvertently recalculated each time the filter is applied to the
Region.
 Which calculation should fix the automatic recalculation on the % of total field?
A. {FIXED [Region]: SUM([Sales])} / SUM([Sales])
B. {FIXED [Region]: SUM([Sales])} / { [Sales] }
C. {FIXED [Region]: SUM([Sales])} / {FIXED :SUM([Sales])}
D. {FIXED [Region]: SUM([Sales])}
Explanation:
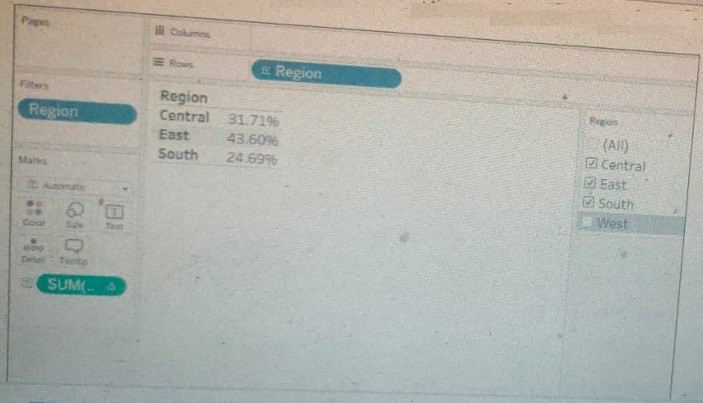
The problem is that a standard "Percent of Total" table calculation recalculates based on the data present in the view. When you filter the view by [Region], the total changes, and therefore the percentage for the remaining region becomes 100%.
To fix this, you need a calculation that defines both the numerator and the denominator independently of the view's filters.
Numerator: {FIXED [Region]: SUM([Sales])}
This calculates the total sales for each region, regardless of any filters applied to the view (except for context filters and extract filters). It gives you a fixed sales number for "Central," "East," etc.
Denominator: {FIXED : SUM([Sales])}
This is a grand total LOD. It calculates the sum of sales across the entire dataset, fixed at the database level. It ignores all filters in the view (except context/extract filters), so it will always return the same total number.
The Result: Dividing the fixed regional sales by the fixed grand total gives you a true, static percentage of the overall total for each region. This percentage will not change when you apply a filter to the [Region] field because both parts of the calculation are computed against the full, unfiltered dataset.
Why the Other Options are Incorrect:
A. {FIXED [Region]: SUM([Sales])} / SUM([Sales]): The denominator SUM([Sales]) is a measure that is still dependent on the view's filters. If you filter the view to one region, the denominator becomes the sales for that one region, making the calculation Regional Sales / Regional Sales = 100%. It does not solve the problem.
B. {FIXED [Region]: SUM([Sales])} / { [Sales] }: This is syntactically incorrect. { [Sales] } is not a valid LOD expression. LOD expressions require an aggregation function like SUM, AVG, etc.
D. {FIXED [Region]: SUM([Sales])}: This only calculates the total sales per region. It does not perform the percentage calculation at all, so it cannot fix the percent of total problem.
Reference & Key Concepts:
FIXED LOD Expressions: Compute values using the specified dimensions, ignoring all other dimensions and filters in the view (with the exception of Context Filters and Data Source Filters).
Order of Operations: LOD expressions are computed after data source filters but before most other types of filters. This is why they can be used to "lock in" a value that is immune to view filters.
Use Case for Grand Total LOD ({FIXED : ...}): Creating key performance indicators (KPIs) or percentages that should always be relative to the entire dataset, not the filtered view.
For the exam, remember that when you need a percentage of total that should not recalculate when a dimension is filtered, you must use a FIXED LOD for both the numerator and the denominator. The denominator must be a grand total LOD ({FIXED : SUM([Measure])}) to remain constant.
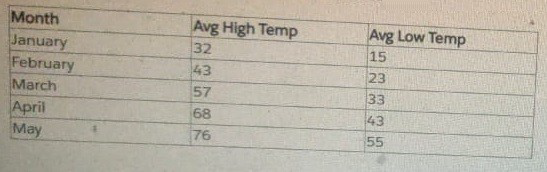
A Tableau consultant is tasked with creating a line graph that shows daily temperature
fluctuations. The below set of data to use to create a dashboard.
How should the consultant manipulate the data to support the business need?
A. Pivot the data before the requested visualization can be created.
B. Request a new set of data that is aggregated to the day level.
C. Create a Level of Detail (LOD) calculation that will aggregate the data at the requested daily level.
Explanation:
The provided dataset contains monthly average high and low temperatures (e.g., January to May), not daily temperature readings. To create a line graph showing daily fluctuations, the consultant needs actual daily data points, not monthly aggregates.
✅ Why B is correct:
The current data lacks the granularity needed for daily visualization.
You cannot interpolate or simulate daily fluctuations from monthly averages without introducing assumptions.
The most accurate and actionable approach is to request a dataset that contains daily temperature values (e.g., one row per day with high/low temps).
❌ Why not the others?
A. Pivot the data
Pivoting would restructure columns (e.g., turning "Avg High Temp" and "Avg Low Temp" into rows), but it does not create daily granularity.
Pivoting is useful for reshaping, not for increasing temporal resolution.
C. Create a Level of Detail (LOD) calculation
LOD expressions aggregate data, not generate finer granularity.
You cannot use LOD to fabricate daily data from monthly averages.
🔗 Reference
Tableau Help: Granularity and Aggregation
Tableau Community: Visualizing Daily Trends from Aggregated Data
👉 Exam takeaway:
When the required visualization demands finer granularity than the source data provides, request a more detailed dataset.
| Salesforce-Tableau-Consultant Exam Questions - Home |
| Page 2 out of 20 Pages |