Last Updated On : 18-Oct-2026
Salesforce Certified Tableau Data Analyst Practice Test
Prepare with our free Salesforce Certified Tableau Data Analyst sample questions and pass with confidence. Our Salesforce-Tableau-Data-Analyst practice test is designed to help you succeed on exam day.
Salesforce 2026
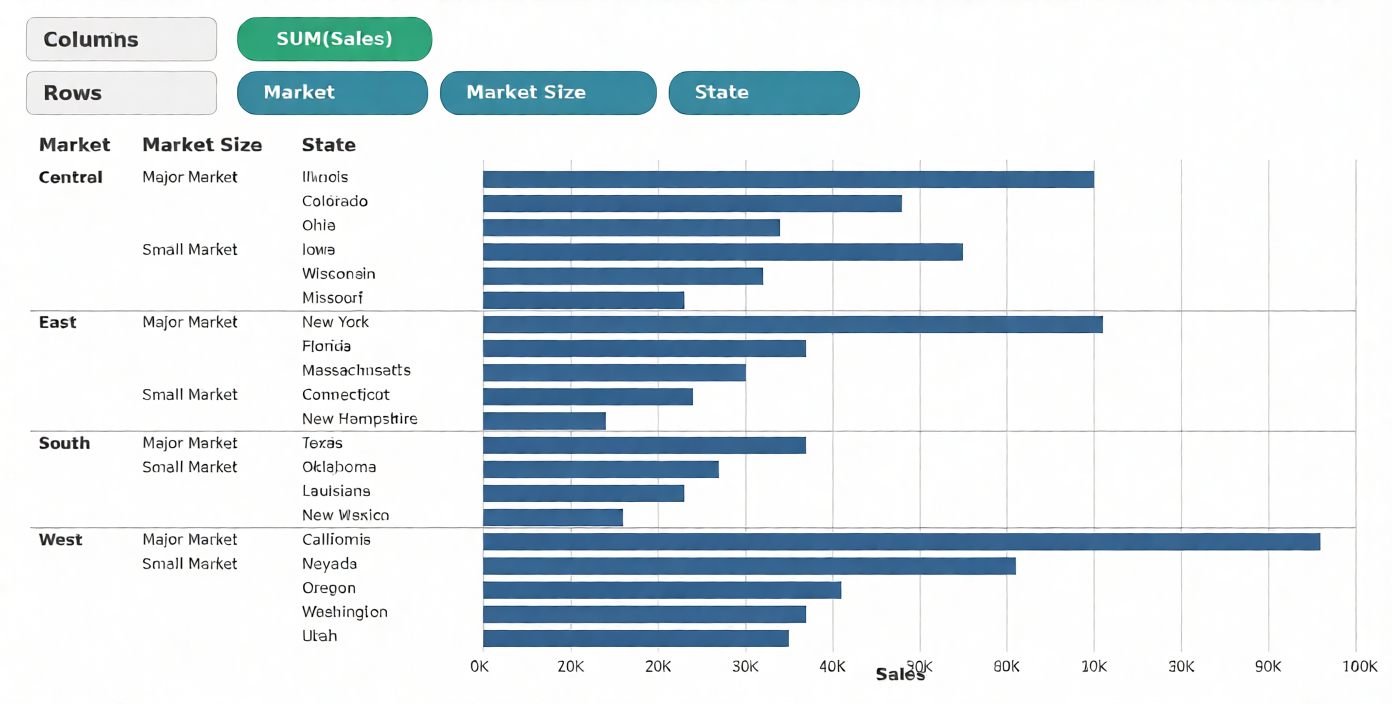
A Data Analyst has the following worksheet in a dashboard that has a hierarchy from Market to Market Size
in the view.
A stakeholder wants to see the total sales for each Market/Market Size depending on which hierarchy level is
in the view.
Which calculation should the analyst use to get the Market and/or Market Size total?
A. { EXCLUDE [State] : SUM([Sales] ) }
B. { FIXED [State] : SUM([Sales] ) }
C. { EXCLUDE [State] : TOTAL([Sales] ) }
D. { FIXED [Market] : { FIXED [Market Size] : SUM([Sales]) } }
Explanation
The correct answer is A. { EXCLUDE [State] : SUM([Sales]) }. The requirement is to display the total sales for each Market and/or Market Size depending on which hierarchy level is in the view. The `EXCLUDE` Level of Detail (LOD) expression removes the specified dimension — in this case, [State] — from the view's level of detail when computing the aggregate. Since the hierarchy drills down from Market to Market Size to State, using `{ EXCLUDE [State] : SUM([Sales]) }` ensures that when State is in the view, the calculation ignores State and returns the total sales at the Market and Market Size level. When the view is expanded to show only Market or Market Size, the EXCLUDE expression continues to aggregate correctly at that level. This makes option A the correct answer.
Why the other options are incorrect:
B. { FIXED [State] : SUM([Sales]) }
– The `FIXED` keyword computes the aggregate at the specified dimension ([State]) regardless of what is in the view. This would return sales totals for each individual State, which is the opposite of what is needed. The analyst needs to exclude State, not fix the calculation to it.
C. { EXCLUDE [State] : TOTAL([Sales]) }
– This calculation combines an LOD expression with the `TOTAL` table calculation function, which is not valid syntax. `TOTAL` is a table calculation that operates on the view's data, and nesting it inside an LOD expression produces incorrect or unpredictable results. Only aggregate functions like SUM, AVG, MIN, MAX, or COUNT should be used inside LOD expressions.
D. { FIXED [Market] : { FIXED [Market Size] : SUM([Sales]) } }
– Nested FIXED LOD expressions are not supported in Tableau. This calculation attempts to nest one LOD inside another, which is invalid syntax and will not compile. Additionally, using FIXED would not dynamically adapt to the hierarchy level in the view.
Reference:
Tableau Desktop Specialist and Tableau Data Analyst content areas on Level of Detail (LOD) Expressions — specifically the EXCLUDE keyword, its use in removing dimensions from the view's level of detail, and its application in hierarchical drill-down analysis with Market, Market Size, and State.
A Data Analyst has the following dataset that contains null values in the Profits field.
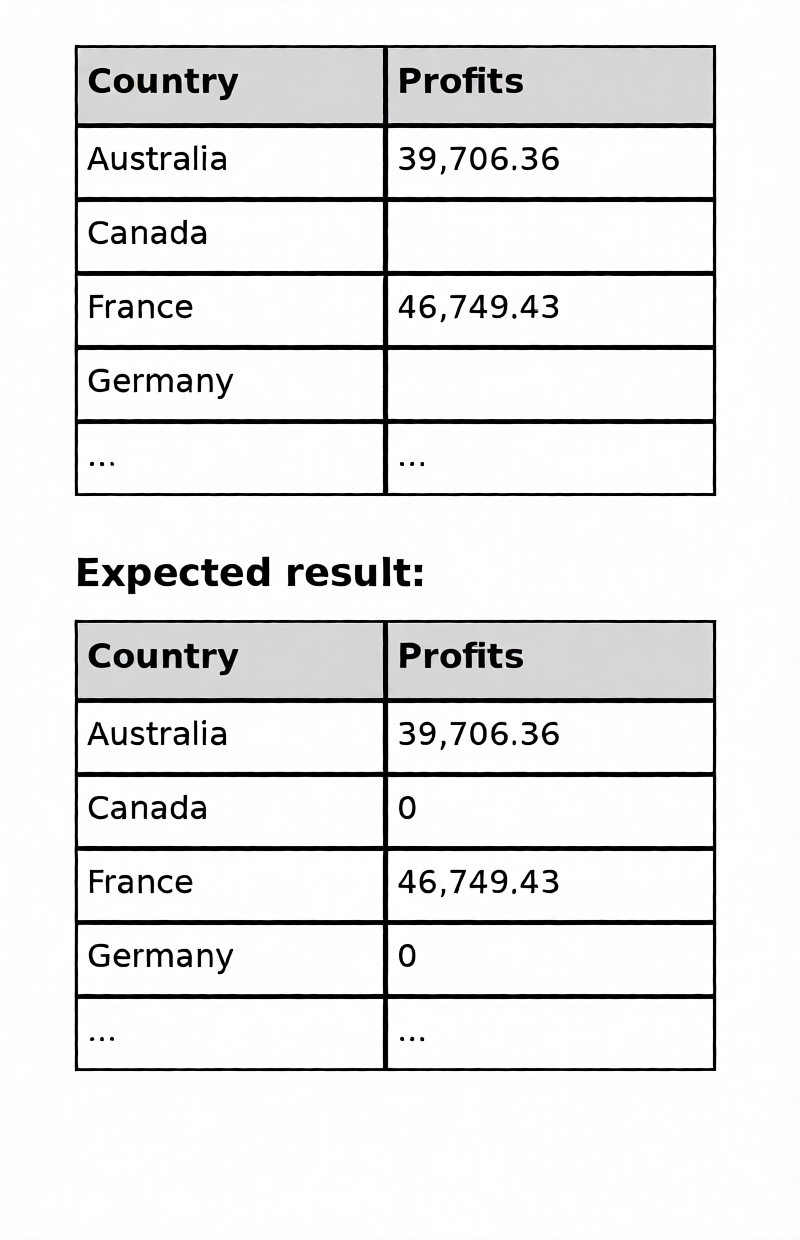
Which two formulas achieve this goal? Choose two.
A. IFNULL([Profits], 0)
B. ISNULL([Profits])
C. IF [Profits] != NULL THEN [Profits] END
D. ZN([Profits])
D. ZN([Profits])
Explanation
The correct answers are A. IFNULL([Profits], 0) and D. ZN([Profits]). In Tableau, both `IFNULL` and `ZN` are designed to handle null values. The `IFNULL([Profits], 0)` function evaluates the [Profits] field and returns the value if it is not null; if it is null, it returns 0. Similarly, the `ZN([Profits])` function (short for "Zero Null") converts any null values in a numeric field to 0. Both formulas achieve the exact requirement of replacing null profit values with 0, making them valid solutions. This makes options A and D the correct answers.
Why the other options are incorrect:
B. ISNULL([Profits])
– The `ISNULL` function is a logical test that returns TRUE or FALSE depending on whether the field contains a null value. It does not replace the null with 0; it only identifies it. This formula would produce a boolean output, not the desired numeric result.
C. IF [Profits] != NULL THEN [Profits] END
– This formula attempts to check if the profit is not null, but it is logically flawed. In Tableau (and most programming languages), you cannot compare a value directly to NULL using comparison operators like `!=` or `=`. NULL is not a value; it is the absence of a value. This condition will not evaluate correctly and will not replace nulls with 0. The correct logical test is `NOT ISNULL([Profits])`.
Reference:
Tableau Desktop Specialist and Tableau Data Analyst content areas on Calculations — specifically null handling functions including IFNULL, ZN, and ISNULL, and their use in data cleaning and preparing numeric fields for analysis.
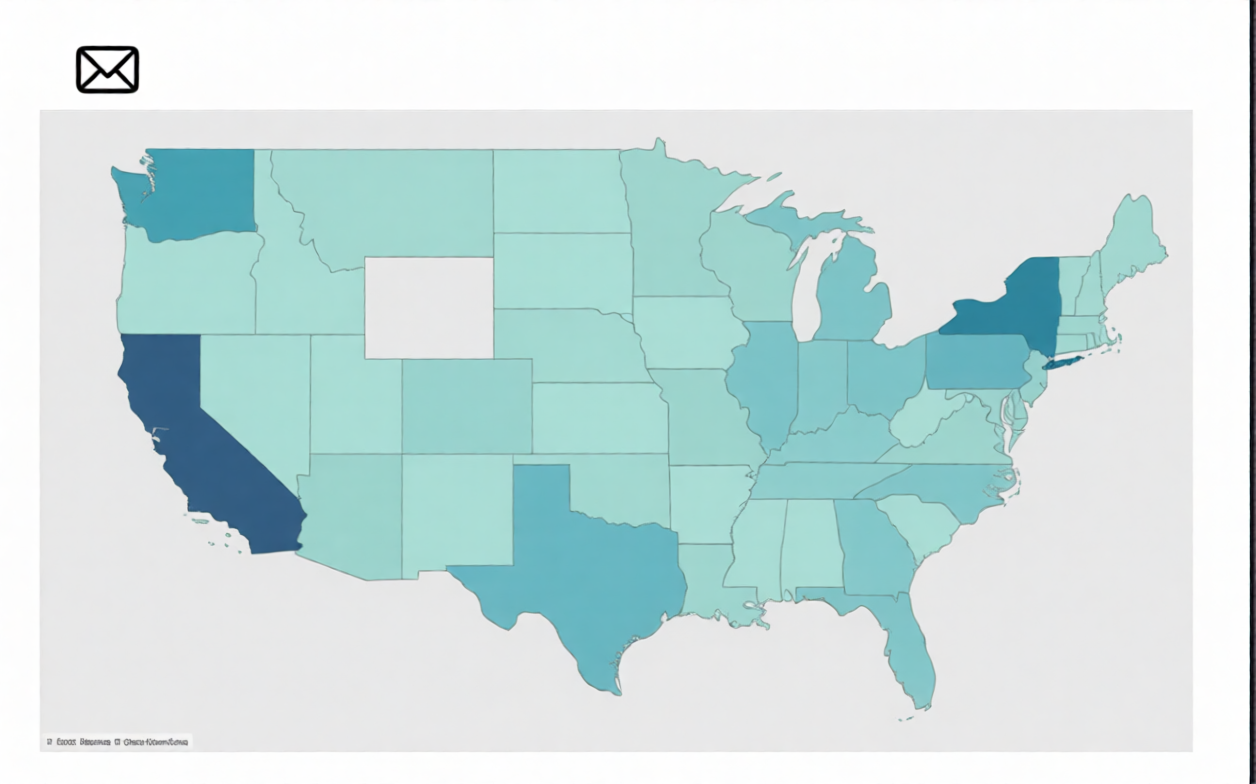
A Data Analyst plans to create the following dashboard.
When a user clicks the envelope icon, an email addressed to support@example.com must open.
Which type of action should the analyst use?
A. Go to URL
B. Change Set Values
C. Filter
D. Go to Sheet
Explanation
The correct answer is A. Go to URL. In Tableau, dashboard actions allow users to interact with the dashboard, and the "Go to URL" action is specifically designed to open a web page or trigger a URL-based operation when a user clicks a designated mark or object. To implement the requirement of opening an email addressed to [support@example.com](mailto:support@example.com), the analyst would use the `mailto:` URI scheme, configuring the URL as `mailto:support@example.com`. When a user clicks the envelope icon, the default email client opens with that address pre-populated. This makes option A the correct answer.
Why the other options are incorrect:
B. Change Set Values
– A Change Set Values action dynamically adds or removes marks from a set based on user selection. It is used for interactive highlighting, filtering, or comparison within the workbook, not for opening external applications like an email client.
C. Filter
– A Filter action restricts the data shown in a target sheet based on selections in a source sheet. It controls what data is displayed within the workbook and cannot trigger external actions such as launching an email.
D. Go to Sheet
– A Go to Sheet action navigates the user to another worksheet or dashboard within the same workbook. It is used for internal navigation and does not open external links or email clients.
Reference:
Tableau Desktop Specialist and Tableau Data Analyst content areas on Dashboard Actions — specifically the Go to URL action, using URL schemes such as `mailto:`, and configuring actions triggered by clicking marks or objects on a dashboard.
| Salesforce-Tableau-Data-Analyst Exam Questions - Home | Previous |
| Page 5 out of 43 Pages |