Last Updated On : 29-Jun-2026
Salesforce Certified Tableau Data Analyst Practice Test
Prepare with our free Salesforce Certified Tableau Data Analyst sample questions and pass with confidence. Our Salesforce-Tableau-Data-Analyst practice test is designed to help you succeed on exam day.
Salesforce 2026
You use a quick table calculation lo calculate the moving average of a measure named
Sales.
You need to calculate the moving averages of the last three years.
Which setting should you change in the Table Calculation dialog box? {Click the
appropriate Option in the Answer Area)


Explanation:
When you apply a Moving Average Quick Table Calculation in Tableau, the default window configuration typically averages the current value alongside the previous 2 values (a 3-period moving anchor window).
The Core Logic:
To restrict or expand the chronological lookback window specifically to a specific horizon (e.g., matching the "last three years" or changing the window bounds), you must edit the secondary properties of the calculation.
The Mechanism:
Clicking on or expanding the Moving Average Options parameter section opens a secondary configuration popover panel. This panel contains input fields for Previous values, Next values, and a checkbox to Include current value. By adjusting the Previous values parameter to 3 (and ensuring Next values is set to 0), you instruct Tableau's window calculation engine to compute the mean across exactly the specified historical interval.
Why Other Options Are Incorrect:
Calculation Type:
Changing this drop-down modifies the entire algorithmic function category (e.g., switching from a Moving Average to a Percent Difference or Running Total), which is not desired here.
Compute Using / Specific Dimensions:
These options adjust the directional pathway and partitioning boundaries across which the calculation travels (e.g., Pane vs. Table), but they do not control the lookback offset window size.
Add secondary calculation:
This is used to chain two different table calculation types back-to-back (such as calculating a Year-over-Year growth rate of a running total), rather than adjusting the single window frame.
References:
Tableau Documentation (Quick Table Calculations: Moving Average): "For a Moving Average table calculation, you can determine the range of values included in the average by editing the Moving Average Options to specify the number of previous and next values."
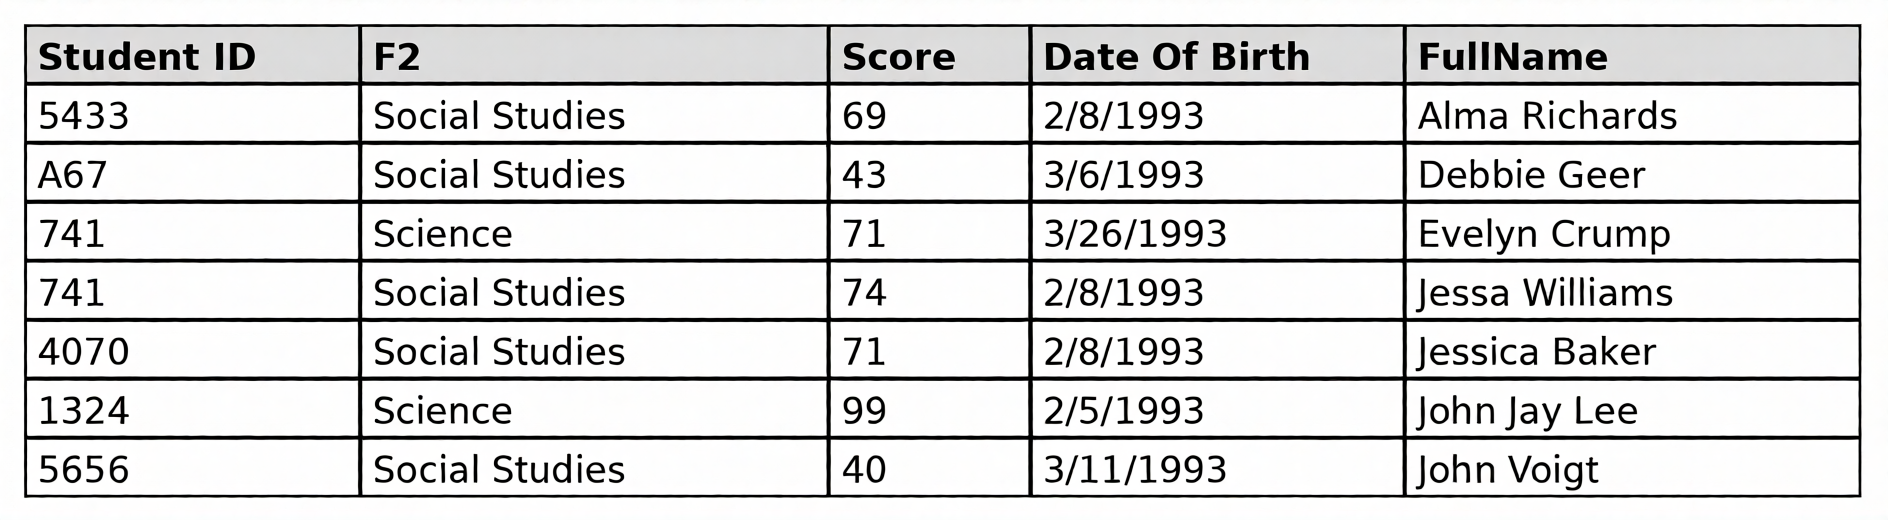
A Data Analyst is given the following table and asked to create a flow that adds a date field
to the data. This field should automatically update as new dates (months) are added to the
original table.

Which technique should the analyst use as the first step to achieve this in Tableau Prep?
A. A wildcard search for multiple tables in the Input step
B. An Aggregate step to reshape the data
C. A Rows to Columns Pivot step
D. A wildcard search to pivot in the Pivot step
Explanation:
The data is structured in a wide format where each month (Jan-24, Feb-24, Mar-24) is a separate column. To add a date field that automatically updates as new months are added, you must first transform this into a tall format where month names become values in a single date column and their corresponding sales values are in another column. This transformation is precisely what a Rows to Columns Pivot step does in Tableau Prep. Once pivoted, the flow will automatically include any new month columns added to the original data, ensuring the date field dynamically updates without manual intervention.
Why other options are incorrect:
A. A wildcard search for multiple tables in the Input step: A wildcard union is used to combine data from multiple files or tables with the same structure, not to reshape a single table's columns into rows.
B. An Aggregate step to reshape the data: Aggregation is used for summarizing data (e.g., calculating sums or averages), not for pivoting or restructuring the table's layout.
D. A wildcard search to pivot in the Pivot step: Tableau Prep does not support wildcard searches within a Pivot step. The pivot step itself is the correct tool for this column-to-row conversion.
Reference:
Tableau Prep Help – Pivot Data from Rows to Columns explains that pivoting transforms wide data into tall format, allowing automatic inclusion of new fields.
You conned to a Microsoft SQL Server database
You need to create a custom SQL query that retrieves rows from a table named Students
Only students m the city of Berlin must be returned
How should you complete the query? (Drag the appropriate Options to the Answer Area
and drop into the correct locations.)


Explanation:
This is a foundational SQL syntax question mapping to Tableau's Custom SQL connection feature.
SELECT *: This specifies the projection phase of the query. The asterisk (*) is the standard wildcard character used to grab all columns/attributes belonging to the targeted relation.
FROM Students: This declares the data source entity. It tells the query engine which database table (Students) to scan for records.
WHERE City = 'Berlin': This applies a row-level filter predicate. The WHERE clause ensures that only rows meeting the exact evaluation condition (where the value in the City attribute matches the literal string 'Berlin') are pulled into Tableau's data cache.
Why Other Options Are Incorrect:
HAVING: A HAVING clause is used exclusively to filter aggregated data after a GROUP BY statement has executed. Since we are dealing with raw row-level filtering rather than aggregated groups (like SUM or COUNT), WHERE is the mandatory filter clause.
GROUP BY: This clause collapses multiple records into summary rows based on shared column values. There is no requirement to aggregate or group data in this query.
References:
Tableau Documentation (Connect to a Custom SQL Query): "You can connect to a specific custom SQL query rather than the entire data set. Writing standard database queries using a WHERE clause allows you to filter data at the database level before it enters Tableau."
You have a dashboard than contains two sheets named Sheet 1 and Sheet 2.
You want to add an object to the dashboard that users can click to switch to a different dashboard in the workbook.
Which object should you add to the dashboard?


Explanation:
In Tableau, the native Navigation object (also known as a Dashboard Button) is specifically designed to allow users to move seamlessly between different dashboards, sheets, or stories within a single workbook.
The Core Logic: When you add a Navigation object to a dashboard layout, you can open its configuration properties and set its action target destination to any other dashboard or sheet tab inside the file.
User Experience: It functions as a clickable element that can be stylized either as a text-labeled button (e.g., "Go to Summary Dashboard") or as a custom image icon, providing a highly intuitive application-style interface for end users.
Why Other Options Are Incorrect:
Extension: This is used to embed custom third-party JavaScript integrations, web plugins, or write-back components into the canvas, rather than basic workbook navigation.
Download: This creates a button that allows users to export the dashboard or its summary records into formats like PDF, PowerPoint, Excel, or images.
Web Page:This object embeds an external URL directly inside an iframe window container within the dashboard view.
Button: While older versions of Tableau referred to this generic class as a button, the explicit object name in the layout pane for moving between sheets/dashboards is Navigation.
References:
Tableau Documentation (Add Dashboard Objects and Set Their Options): "Use the Navigation object to let your audience quickly navigate from one dashboard to another, or to other sheets or stories."
A Data Analyst has the following chart

The analyst needs to enable the drilldown from Category to Subcategory as shown in the
following chart.

What should the analyst create?
A. A bin for Category and a bin for Subcategory
B. A hierarchy of Category and Subcategory
C. A combined set for Category and Subcategory
D. A group of Category and Subcategory
Explanation:
The requirement is to enable drilldown from Category to Subcategory, meaning users should be able to click on a Category (e.g., Furniture) and see its underlying Subcategories (e.g., Bookcases, Chairs, Furnishings) in the same view. This is the classic drill-down behavior in Tableau, which is achieved by creating a hierarchy.
Why B is correct:
A hierarchy in Tableau allows users to navigate from a higher-level dimension (Category) to a lower-level dimension (Subcategory) by clicking the "+" icon on the field or using the drill-down buttons.
Once a hierarchy is created (e.g., Category → Subcategory), the user can expand any Category to see the Subcategories within it, exactly as shown in the second chart.
Hierarchies are the standard Tableau feature for enabling drill-down navigation.
Why other options are incorrect:
A. A bin for Category and a bin for Subcategory:Bins are used to group continuous numeric data into equal-sized buckets (e.g., age groups, sales ranges). They are not used for drill-down navigation between categorical dimensions.
C. A combined set for Category and Subcategory: Sets are used to create custom subsets of data based on conditions or selections. They do not enable hierarchical drill-down behavior.
D. A group of Category and Subcategory: Groups are used to manually combine multiple dimension members into a single category (e.g., combining "Bookcases" and "Chairs" into a "Furniture" group). Groups do not provide the ability to drill down from a parent to child level.
Reference:
Tableau Help: Create Hierarchies – Hierarchies allow users to drill down from one dimension to another, enabling navigation from high-level to detailed data.
| Salesforce-Tableau-Data-Analyst Exam Questions - Home | Previous |
| Page 4 out of 35 Pages |